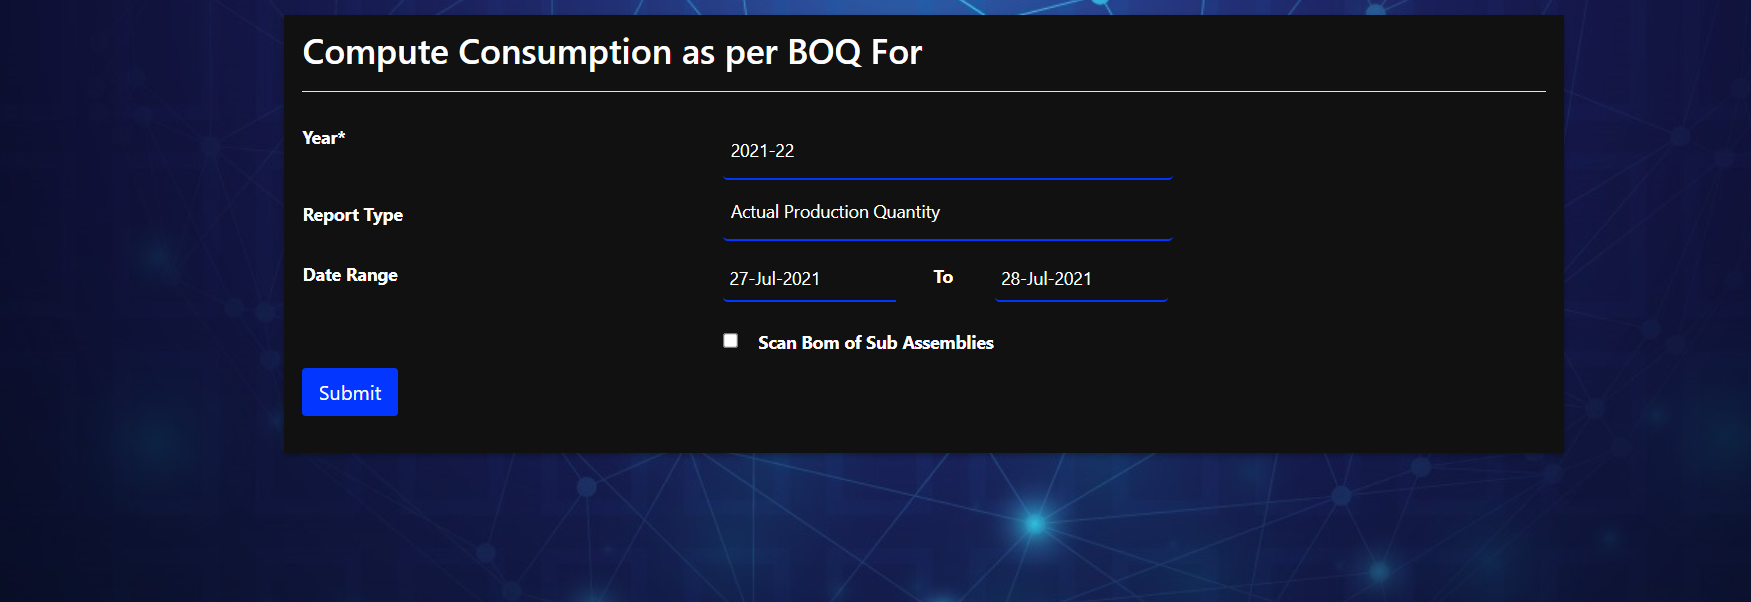
Step for Consumption of material
- Actual Production quantity without any checkbox.
-
First, you have to select a financial year that is for the Period for 2021-22
-
Select report type as Actual Production quantity.
-
Select start date and end date as 27-july-2021 and 28-july-2021 respectively.
-
Then click on submit to generate the report.

The report is generated in excel and you can see the following various sheet in it.
A. Actual production.
B. Output wise actual consumption.
C. Input wise actual consumption.
D. Input wise Consumption summery.
Actual Production :
So this is how Actual Production looks like
| JobNo | Date | Output Name | Item Id | Item Name | Quantity |
|---|---|---|---|---|---|
| 000095 | 28-JUL-2021 | RESISTOR 1% 7.1K 0.25 W 1206 | 007175 | FG-01 | 50 |
| 000095 | 28-JUL-2021 | RESISTOR 1% 7.1K 0.25 W 1206 | 007176 | FG-02 | 100 |
Input Wise Consumption Summery:
So this is how Input Wise Consumption Summery looks like
| Input Id | Item Name | Stage | Consumption | Rate | Value |
|---|---|---|---|---|---|
| 007177 | RM-01 | 00 | 100 | 120 | 12,000 |
| 007178 | RM-02 | 00 | 500 | 250 | 1,25,000 |
| 007179 | RM-03 | 00 | 500 | 380 | 1,90,000 |
| 007182 | SA01 | 00 | 400 | 0 | 0 |
2.Actual Production quantity with Scan Bom of Sub-Assembly.
-
Enter data as you have enter in previous section.
-
Click on check box Scan bom for Sub-Assemblies.
This will Scan and display all the sub-assemblies in excel from bill of material.
Actual Production Table :
So this is how Actual Production tables looks like With Sub-Assemblies.
| JobNo | Date | Output Name | Item Id | Item Name | Quantity |
|---|---|---|---|---|---|
| 000095 | 28-JUL-2021 | RESISTOR 1% 7.1K 0.25 W 1206 | 007175 | FG-01 | 50 |
| 000095 | 28-JUL-2021 | RESISTOR 1% 7.1K 0.25 W 1206 | 007176 | FG-02 | 100 |
Input Wise Consumption Summery:
So this is how Input Wise Consumption Summery looks like With Sub-Assemblies.
| Input Id | Item Name | Stage | Consumption | Rate | Value |
|---|---|---|---|---|---|
| 007177 | RM-01 | 00 | 100 | 120 | 12,000 |
| 007178 | RM-02 | 00 | 500 | 250 | 1,25,000 |
| 007179 | RM-03 | 00 | 500 | 380 | 1,90,000 |
| 007180 | RM-04 | 00 | 2400 | 440 | 10,56,000 |
| 007181 | RM-05 | 00 | 16800 | 1800 | 3,02,40,000 |
3.Dispached Quantity without any checkbox.
-
First, you have to select a financial year that is for the Period for 2021-22
-
Select report type as Dispached quantity.
-
Select start date and end date as 27-july-2021 and 28-july-2021 respectively.
-
Then click on submit to generate the report.
4.Dispached Quantity with Scan Bom of Sub-Assembly.
-
Enter data as you have enter in previous section.
-
Click on check box Scan bom for Sub-Assemblies.
This will Scan and display all the sub-assemblies in excel from bill of material.
5.IIRS Consumption / Lead time
-
First, you have to select a financial year that is for the Period for 2021-22
-
Select report type as IIRS Consumption / Lead time
-
Select start date and end date as 27-july-2021 and 28-july-2021 respectively.
-
Then click on submit to generate the report.
The report is generated in excel and you can see the following two sheet in it.
A.IIRS consumption lead time.
B.Lead time.
IIRS consumption lead time :
So this is how Actual Production looks like
| Itemid | Item name | Qty | Rate | Value | Lead Time | Item group name | segment |
|---|---|---|---|---|---|---|---|
| 007175 | FG01 | 50 | 0 | 0 | 0 | 035NA | 000 NA |
| 007176 | FG02 | 100 | 0 | 0 | 0 | 035NA | 000 NA |
Lead time :
So this is how lead time looks like
| Itemid | Item name | Grn no | Grn date | Indent no | Indent date | Lead time |
|---|